
Matching single cells to a reference cell type
By Maxime Caron
For more than a decade it has been possible to profile the transcriptome of single cells and numerous analytical methods have emerged over these years [1]. C3G is currently undertaking one such single cell transcriptomic project. A useful analysis technique has been to project individual cells onto a cell type reference to find the most similar cell type of unlabeled and/or malignant cells. One simple approach uses R [2] and two dimensionality reduction algorithms (PCA [3] and UMAP [4]) as well as k-nearest neighbours (kNN) [5] to project cells onto a cell type reference and assess the accuracy of these projec-tions. This approach focuses on the independent processing of both training and test sets to limit over-fitting and showcases the superior performance of UMAP compared to PCA in this application.
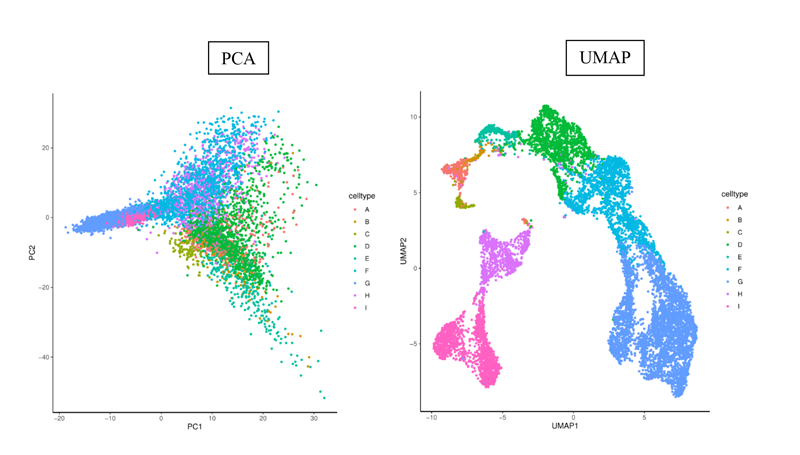
A set of 10,000 cells from 9 cell types (labeled A to G) is used. The PCA and UMAP representations of these cells are shown below and we observe a more refined representation using UMAP.
The projection procedure starts by iteratively randomly splitting the dataset into 70% training and 30% test sets. For each iteration we:
1) Normalize for sequencing depth and log transform the expression counts on the training and test sets independently.
2) Feature select (most variable genes) on the training set and intersect these features in the test set.
3) Run PCA on the standardized expression values of the training set and apply the trained PCA object to the test set to obtain the principal components of each cell.
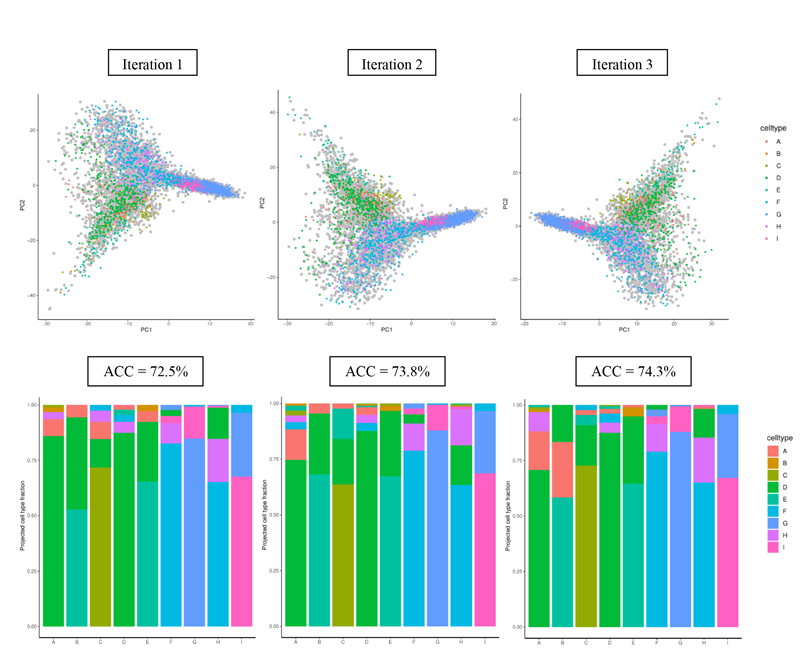
Three iterations of this procedure using PCA only are shown below. The training cells appear in grey and the test cells appear coloured. We assign the projected cell type of each test cell using k nearest neighbors (e.g., k=10) on the PC1 and PC2 values. In this example, the accuracy of the projections is defined as the overall fraction of cells that are correctly identified. We observe low projection accuracy for some cell types and overall average accuracy using PCA due to its coarse representation.
We then generate a UMAP representation of the training set using the previously computed principal components and use the trained UMAP object to get the UMAP coordinates of the test cells:
4) Run UMAP on the training set using the top principal components of PCA (e.g., 30).
5) Obtain the UMAP coordinates of the test cells using the trained UMAP object and the principal components of the test cells generated in step 3.
Three iterations of this procedure are shown below. This time we assign the projected cell type of each test cell using k nearest neighbors on the UMAP1 and UMAP2 values.
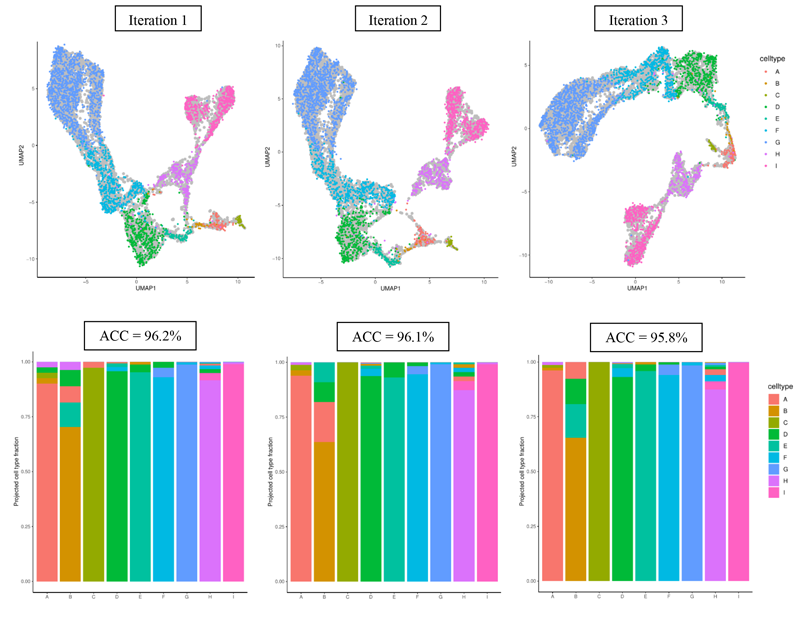
Using UMAP, we observe more defined cell type clusters and an increase in overall projection accura-cies. This process can be repeated enough times to obtain a distribution of either cell type specific val-ues or overall accuracy values.
References
- [1] Tang, F., Barbacioru, C., Wang, Y., Nordman, E., Lee, C., Xu, N., … & Surani, M. A. (2009). mRNA-Seq whole-transcriptome analysis of a single cell. Nature methods, 6(5), 377-382.
- [2] R Core Team, R. (2013). R: A language and environment for statistical computing.
- [3] Pearson, K. (1901). LIII. On lines and planes of closest fit to systems of points in space. The London, Edinburgh, and Dublin Philosophical Magazine and Journal of Science, 2(11), 559-572.
- [4] McInnes, L., Healy, J., & Melville, J. (2018). Umap: Uniform manifold approximation and projection for dimension reduction. arXiv preprint arXiv:1802.03426.
- [5] Fix, E. (1951). Discriminatory analysis: nonparametric discrimination, consistency properties. USAF school of Aviation Medicine.
Published: February 23, 2021