


Making New Discoveries Using Public Data
Every research project is composed of three key elements: a question to answer, the analyzes to perform and the data to use. Often, that last component is limiting. Indeed, producing new data is expensive and sometimes even time-consuming. Thankfully, a solution exists in the form of huge libraries accessible with a few clicks: public data.
Advantages of Using Public Data
Databases are full of useful data covering various techniques, technologies, and organisms. For example, the Encyclopedia of DNA Elements (ENCODE) harbors more than 17000 datasets on human, mouse, worm and fly, from RNA sequencing to whole-genome sequencing through protein binding1,2. Not only is public data easily accessible and free, it may also be stored in its raw and pre-processed form, requiring less time and costs in subsequent analyses (do not forget to perform quality controls first!) While more bioinformatics-inclined papers often use pre-existing datasets to compare tools, they are otherwise greatly overlooked, either because we assume all that could be done with it has been done or because it does not have the exiting spark of novelty. But datasets may have been analyzed using only one angle and could still hold many secrets, even if there are a few years old. Additionally, the ever-growing performance of new algorithms may permit to extract information that was hidden in the data before. For those reasons, it can be valuable to re-analyse public data and this can lead to new discoveries.
How to Use Public Data Efficient
Public databases contain information about many diseases, cell types, organisms and techniques, but it is still limited to what has been explored before. One must thus slightly change his way to approach data in order to find a new angle to analyze. Thus, instead of the typical “formulate question -> how to answer the question -> produce data” workflow, the preparation requires to scout the existing datasets to find some that have a potential for new discoveries. The analyzes have to be centered around the available data rather than the opposite.
Example of New Discovery from “Old” Data
1- Formulate the research question
For my research project, I wanted to study the relationship between transcription and 3D conformation of the DNA in the nuclear space. Various studies tried to explore this before, some of the earliest dating from 19933, but the mechanism is complex and there are still many unknowns.
2- Explore datasets
One of the most common diseases in human is lung cancer. Because of its prevalence and mortality rate, it is also one of the most studied diseases and thus the data produced is widely available. I thus chose to use the A549 cell line, a lung cancer cell line. Various data types were generated from it (RNA-seq, ChIP-seq, Hi-C), permitting to explore both the transcription events and the architecture in these cells. Moreover, being a cell line, it should have less cell-to-cell variability than cells coming from a patient biopsy.
3- Adapt the angle of exploration
As many other studies, including the ones from with the data I used was produced, tried to explore the inter-relation between transcription and 3D folding, a new angle had to be found. A literature review showed there were still many unknowns regarding the different types of boundaries limiting co-regulation between genes.
4- Discover!
A striking tendency that was seen while exploring the data was that the relative orientation of genes seems to influence their probability of co-regulation. We thus proposed a model stating simple “rules” that affect the probability of co-regulation of two genes in A549 cells (Figure 1). In other words, Genes located on the same strand have a very high chance of co-regulation, as the transcription machinery could just slide from one gene to the other. When genes are located on different strands, there is less chance of co-regulation as the machinery would have to completely un-bind, then re-bind to the opposite strand. The change of strand thus introduces a type of co-regulation boundary. Finally, stronger boundaries that have been described before, such as TAD boundaries or the co-localization of Cohesin and CTCF, disrupt more strongly the probability of co-regulation. The discovery of tendencies that serve as a base to the proposed model have all been made using public data.
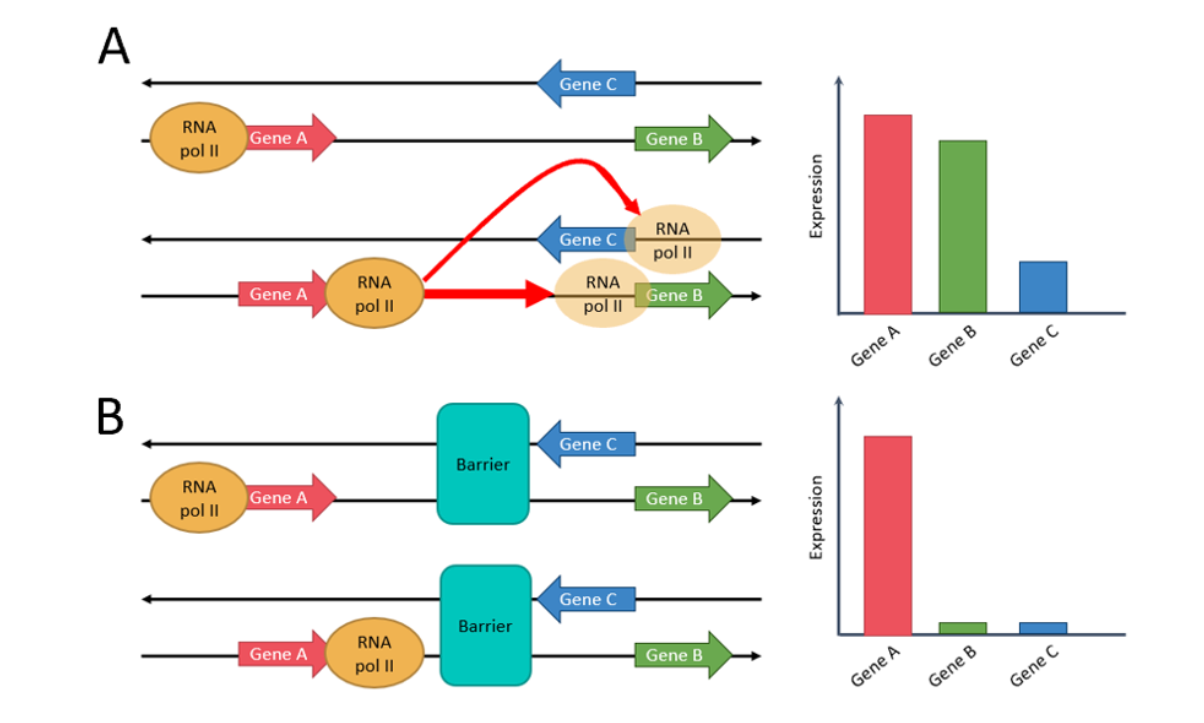
Figure 1: (A) Same-strand genes are very likely to be co-expressed, as the RNA pol II just needs to continue its path along the strand. Divergent and convergent genes are less likely to be co-expressed, as the RNA pol II would needs to detach and reattach itself to go from one gene to the other. (B) When genes are separated by a barrier (CTCF and Cohesin or TAD boundary), there is complete disruption of co-expression.
References:
- 1. The ENCODE Project Consortium. An Integrated Encyclopedia of DNA Elements in the Human Genome. Nature 489, 57–74 (2012).
- 2. Davis, C. A. et al. The Encyclopedia of DNA elements (ENCODE): data portal update. Nucleic Acids Research 46, D794–D801 (2018).
- 3. Jackson, D. A., Hassan, A. B., Errington, R. J. & Cook, P. R. Visualization of focal sites of transcription within human nuclei. EMBO J 12, 1059–1065 (1993).